
Overview
At CRISP Reporting Service (CRS), we believe that access to review past performance can enable change in future results. We are inspired to do our part in helping health care organizations achieve the triple aim by building reporting analytic tools with claims data (health care financial transactions for patient visits). CRS hosts a portal where users can access these reporting tools to filter and query the data from past claims to identify future opportunities or areas of improvement.
CRISP partners with the Health Services Cost Review Commission (HSCRC) to provide monthly reports to all Maryland hospitals. The CRS team can provide an updated analysis of inter-hospital trends and utilization by linking hospital all-payer Case Mix data with unique patient identifiers. Health care organizations leverage CRS reports to drive quality improvement, strategic planning, financial modeling, and other activities.
CRS uses multiple data sources to offer a unique perspective on readmission rates, potentially avoidable utilization, and other critical measures. All CRS products are approved by the Reporting and Analytics Committee, a subcommittee of the CRISP Board, and adhere to best practices in privacy and security.
CRS Report Categories


Learn more about the CCLF Data Set
CCLF Data Basics
View the CCLF Data basics to gain a complete understanding of these Medicare data used to populate the CRS Medicare reports.
CRISP Reporting Services Portal
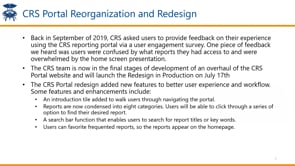
The CRISP Reporting Services (CRS) Portal provides secure access to Maryland health care data and related analytics tools to assist health care organizations in improving patient care throughout the state. The CRS Portal hosts a variety of static and interactive reports primarily from two main data sources, the HSCRC Case Mix data and Claim and Claim Line Feed data for Maryland. Reports are designed for an array of users including hospitals, primary care physicians, local health departments, and skilled nursing facilities. Users are able to look at patient and population level data based on the report, and our panel reports provide users the opportunity to look at population subset of their ENS Panel. When entering the CRS Portal, users will see blue cards on their screen based on the reports they are credentialed to view. The reports are condensed into eight blue tiles based on population and data source. Most users will only have access to some of the tiles, as reports are designed for multiple types of users. Users can easily navigate to their desire report through a series of tiers and can favorite frequented reports. The CRS Portal also contains information on the latest data refreshes, enhancements, and updates, so users can stay updated on changes.

CRS Portal Overview Videos
CRS Portal Design Webinar
CRS Credentialing Training
CRS Portal Two Factor Authentication
CRS Portal Design Webinar
Learn how the CRISP Reporting Service Portal is organized.
CRS Credentialing Training
Overview of how organization point of contacts can manage their companies CRS Portal users.

CRS Portal Two Factor Authentication
Understand how to set up two factor authentication for CRS Portal Logins.


